
Texas (ERCOT) - The path to NetZero
A monthly review of Key Performance Indicators (KPIs)

Month: July 2025
REV 1 - Aug 8, 2025 - Improve Import Low-Carbon estimate.
Summary
The Texas (ERCOT) Grid has made some progress toward a Low-Carbon grid. However substantially more Wind, Solar and especially Energy Storage capacity is needed.
To fully assess the progress made on the pathway to NetZero, we use the following Key Performance Indicators (KPIs):
KPI #1: RE (NET) - Low-Carbon
To eliminate hydrocarbons from the grid, it is necessary for Low-Carbon generation to provide a consistent, constant and reliable supply of energy to the grid 24/7/365.
RE (NET) must have near ZERO variation.
Maximum RE (NET) must be consistently at 100%.
Minimum RE (NET) must also be consistently at or near 100%.
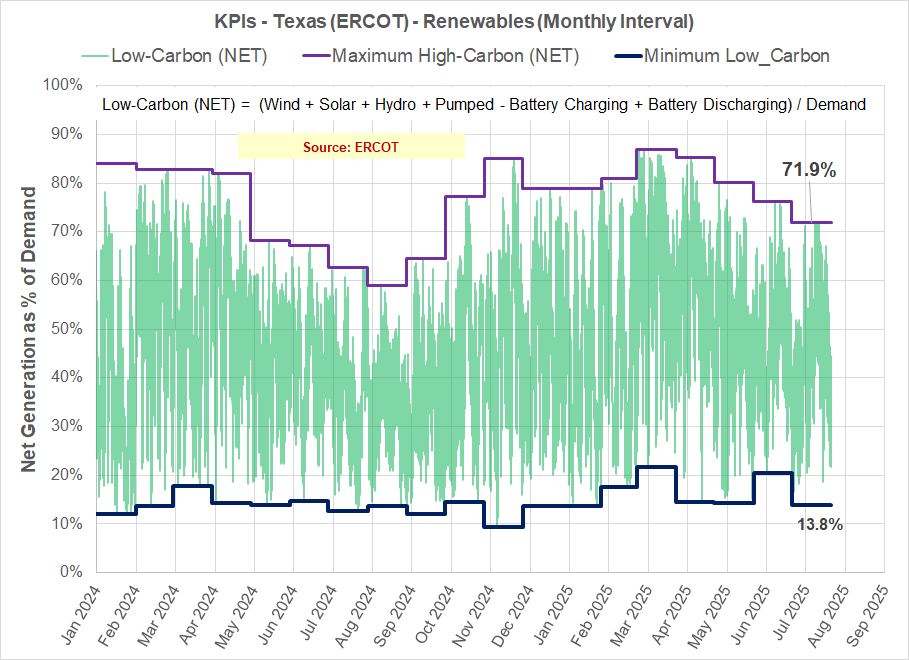
Figure 1 illustrates the progress during July 2025:
RE (NET) variation is 58.1% of demand. Target: ZERO.
Maximum RE (NET) is 71.9% of demand. Target: 100%.
Minimum RE (NET) is 13.8% of demand. Target: ~100%.
Highest RE (NET) generation occurred during Mar 2025.
To Date, very little progress has been achieved on the pathway to a Low-Carbon Grid
KPI #2: Peak - High-Carbon Generation
When reviewing High-Carbon generation, there are two distinct indicators:
Average net generation.
Peak generation.
To achieve a low-carbon grid, both the Average Net Generation and the Peak Generation must fall to Zero.
Just lowering the Average while maintaining Peak generation results in significantly increased costs. For more information, please see: Link - CF vs. LCOE
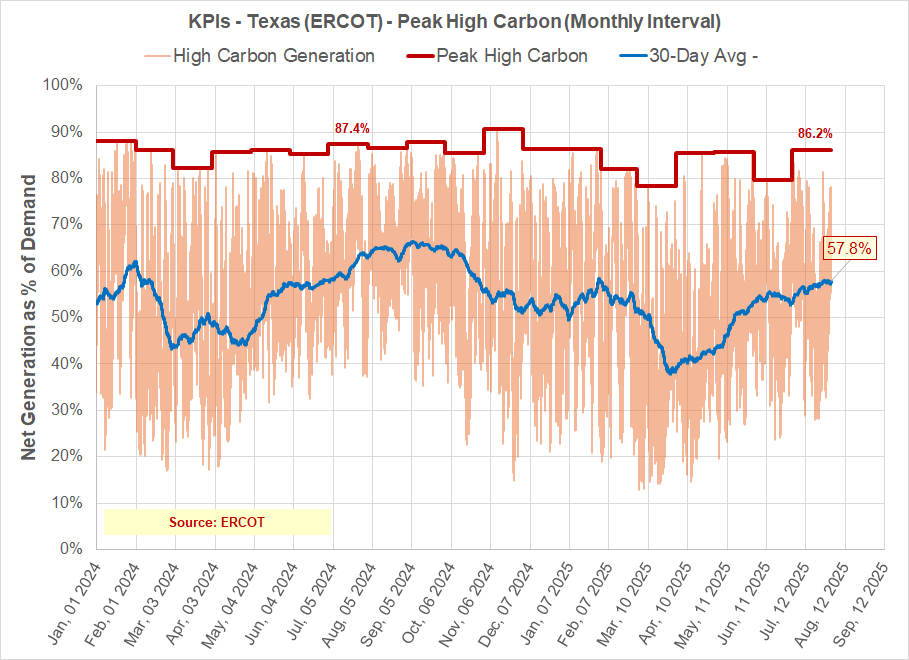
Figure 2 illustrates the progress during July 2025
Peak high-carbon generation was 86.2% of demand. Target: ZERO.
Average Generation was 57.8%. Target: ZERO.
To Date, there appears to be a small amount of progress reducing the Average. Very little progress has been made reducing PEAK High-Carbon generation.
KPI #3a & 3b: Energy Storage
Energy Storage has two important ratings:
Power (MW or GW): This is the sizing of the converters/inverters that charge the storage and then discharge that storage less losses back to the grid.
May also be limited by absorption rate and/or discharge rate of storage modules.
Energy (MWh or GWh): This is the total energy, that the storage units can absorb and retain.
Usable capacity is always less than installed capacity. It is limited by State of Charge (Low), typically 10% and State of Charge (High) typically 90%. This is necessary to extend service life and reduce maintenance of the storage modules.
Of the two, the most important is Energy. To reach 100% low-Carbon a substantial amount of Storage Energy Capacity is required to provide reliable, continuous discharge when needed.
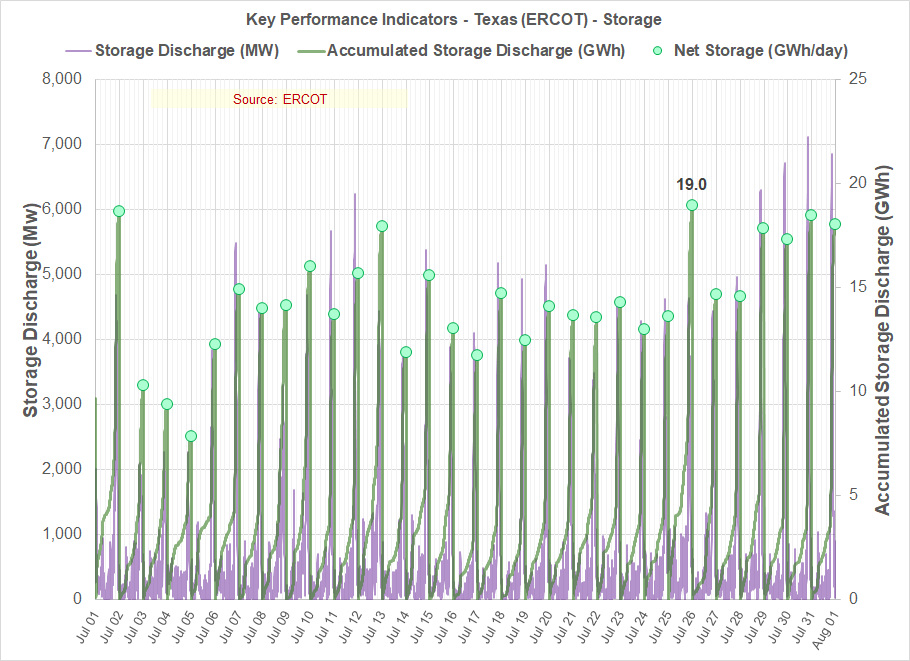
Figure 3a illustrates the comparison between Momentary Storage Discharge and Net Daily Energy Discharge during the period.
Momentary storage discharge (MW) was highly variable over the month with peaks lasting only a few minutes. Target: Continuous output over the day when wind and solar are not available.
Accumulated Storage Discharge (GWh) was highly variable with no consistency. Target: Constant output equal to demand MINUS Low-Carbon generation.
During the month, Net Storage (GWh/day) remains only a fraction of what is required to reach 100% Low-Carbon.
To achieve a 100% Low-Carbon grid, energy storage must displace ALL hydrocarbons
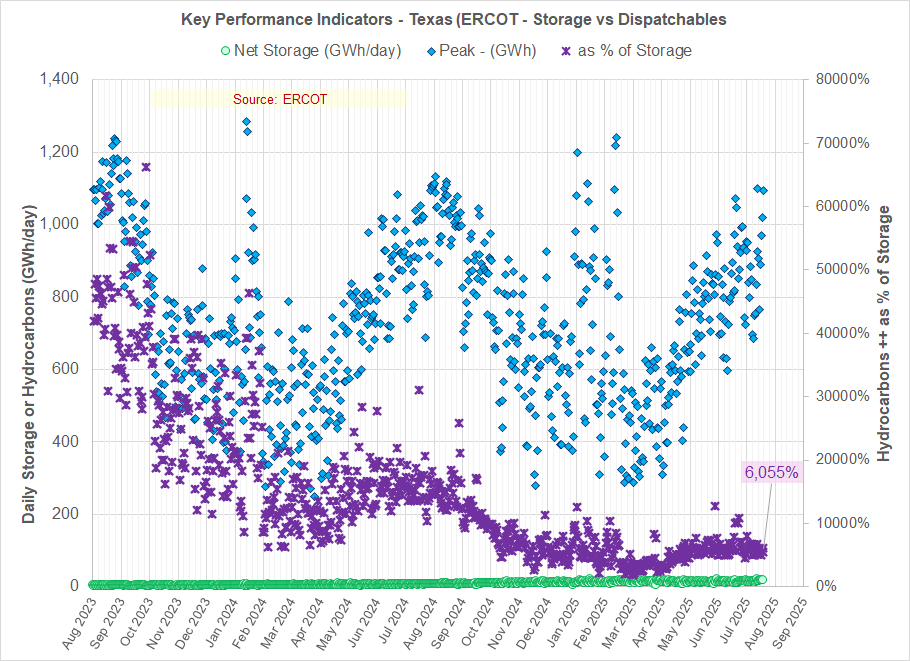
Figure 3b illustrates daily net energy storage (GWh/day) compared to daily net hydrocarbon generation (GWh/day)
Daily net energy storage is only a fraction of hydrocarbon generation and while showing some growth, is critically insufficient. Target: Hydrocarbon = 0 GWh/day.
Hydrocarbon generation is 6,055% of storage discharge. Target: 0%.
Current energy storage capacity is only a fraction of what is that required to achieve a 100% Low-Carbon grid.
Bonus Round
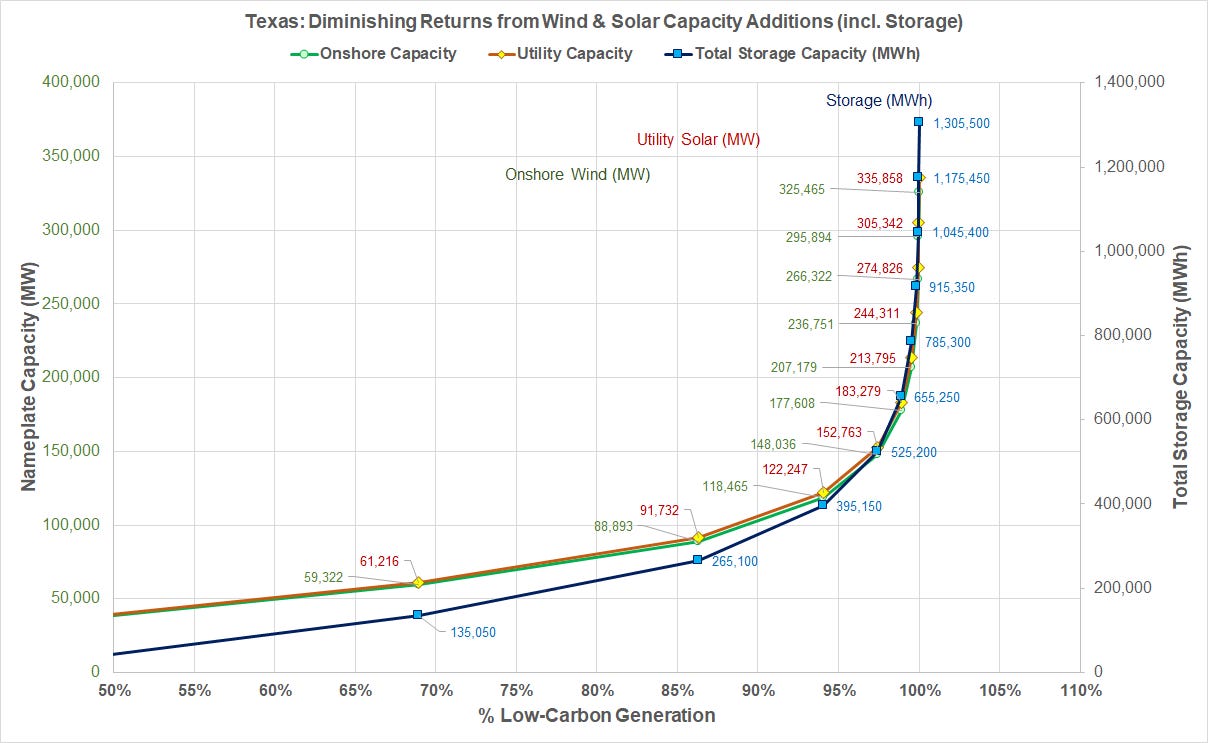
The question now arises…. How much Wind, Solar and Storage capacity must be added to achieve a 100% Low-Carbon grid?
Due to the effect of Diminishing Returns, adding incremental capacity does not result in a proportional increase in generation. This is illustrated in Figure 4.
The practical limit for Low-Carbon generation is ~95%. Above that, it takes exponentially more capacity, more Capex and results in a significantly higher FCOE.
As Always, I welcome respectful comments, questions and suggestions for upgrades.
Hi Bill,
Interesting read.
I think your 'bonus round' should inform your earlier KPIs.
Aiming for 100% 'renewable' power hits the 'diminishing returns' buffers.
So I think the solution will require a compromise between the absolutists and the pragmatists.
Maybe somewhere around 80% would be my guess, but greatly depending on the total installed cost of energy storage and how that develops.
Another approach is to calculate the amount of storage required to cope with the worst case scenario for the supply of wind - the fundamental input to the wind power system.
The worst case scenario is a series of nights in close succession with little or no wind. In Australia the longest run of low wind nights is three but there are months with up to 10.
Then there is the problem iofcharging the batteries, or the pumped hydro system. Currently the batteries are charged while prices are negative and they feed into the grid during the evening peak. However to ride through windless nights the charge can only accumulate day on day when there is enough wind and solar in the system to deliver a surplus almost every day.
My colleague John McBratney has explained that the charging problem, in a grid without a considerable amount of dispatchable power, is insurmountable.
https://rafechampion.substack.com/p/grid-scale-electricity-storage-why