


Wind / Solar and the Effect of Diminishing Returns

There's a widespread misconception that adding more Wind and Solar capacity directly correlates with a proportional increase in net generation. For instance, if a grid currently has 20% of its energy coming from Wind and Solar, tripling the installed capacity would NOT automatically mean that Wind and Solar would then contribute 60% of the energy.
Why Variability Matters
The electrical grid requires a precise, second-by-second balance between the supply of electricity and its demand. Any significant imbalance can lead to blackouts or even cause a total grid collapse.
Both wind and solar power are characterized by their variability, unreliability, and unpredictability. These sources are not dispatchable; they cannot be controlled to match the demand as it fluctuates.
Contrary to popular belief, simply increasing the capacity of renewable energy sources like wind and solar does not necessarily decrease variability or ensure consistent power generation.
We can observe this through the analysis of real-time data on UK wind and solar generation from 2016 to 2024 (Figure 1), during which 26.9 GW of new nameplate capacity was added. Over this period, the minimum generation levels did not increase; instead, the overall variability of power output actually increased. This escalation in variability necessitates more "firming" or backup capacity to maintain grid stability.
The 180 day average is now growing at a lower rate than in the earlier years.
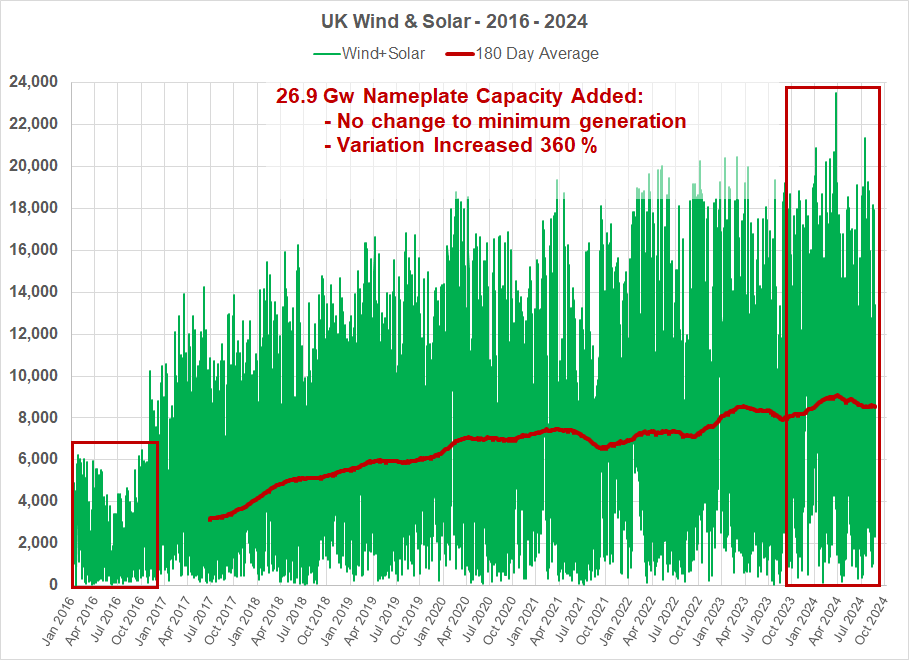
As more nameplate capacity of Wind and Solar is installed, peak generation tends to increase, but it soon encounters limitations due to either transmission constraints or because it surpasses current demand. Consequently, there comes a point where Wind and/or Solar generation must be curtailed (i.e., shut down or reduced) to maintain grid stability.
Understanding the Basics
The simplified graph (Figure 2) is based on 14 days of real-time net generation data from Alberta, Canada’s grid (AESO). It shows the sum of wind + solar generation in 5-min increments.
The first period, shows the net generation from the current installed nameplate capacity of wind + solar.
The 2nd, 3rd and 4th periods show the impact on net generation if capacity is increased by 2-times, 3-times and then 4-times.
The line named “Demand/Transmission Limit” is the maximum generation the grid can accept either due to limitations imposed by the transmission & distribution system or due to all demand being met.
As capacity is added, the gain in net generation becomes progressively smaller as curtailment grows.

Expanding on the Basics
The scenario shown in Figure 3 illustrates the principle of diminishing returns for each additional increment of nameplate capacity. Specifically, the net increase in generation for each new unit of capacity becomes progressively smaller:
Transmission Constraints: The grid's ability to transport power from where it's generated to where it's needed can limit the effective use of high renewable output, especially if generation exceeds local demand.
Excess Generation: When generation outstrips demand, especially during high-output conditions like sunny days or windy periods, the excess energy might not be used, leading to curtailment.
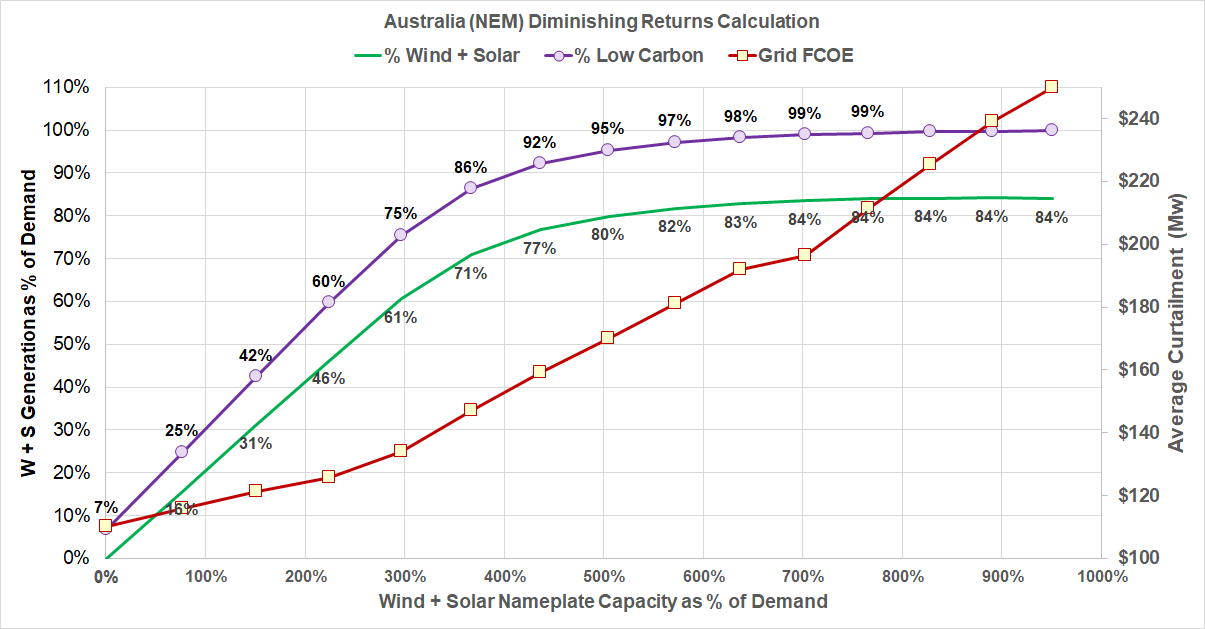
When modeling Australia's National Electricity Market (NEM) with increasing Wind and Solar nameplate capacity, this relationship between installed capacity and actual net generation becomes evident.
The model shows that as total capacity increases, actual energy delivered to thr grid does not increase at the same rate. This demonstrates the law of diminishing returns in renewable energy integration.
As capacity increases, so does FCOE (Wholesale Price). Increasing wind and solar integration increases consumer costs.
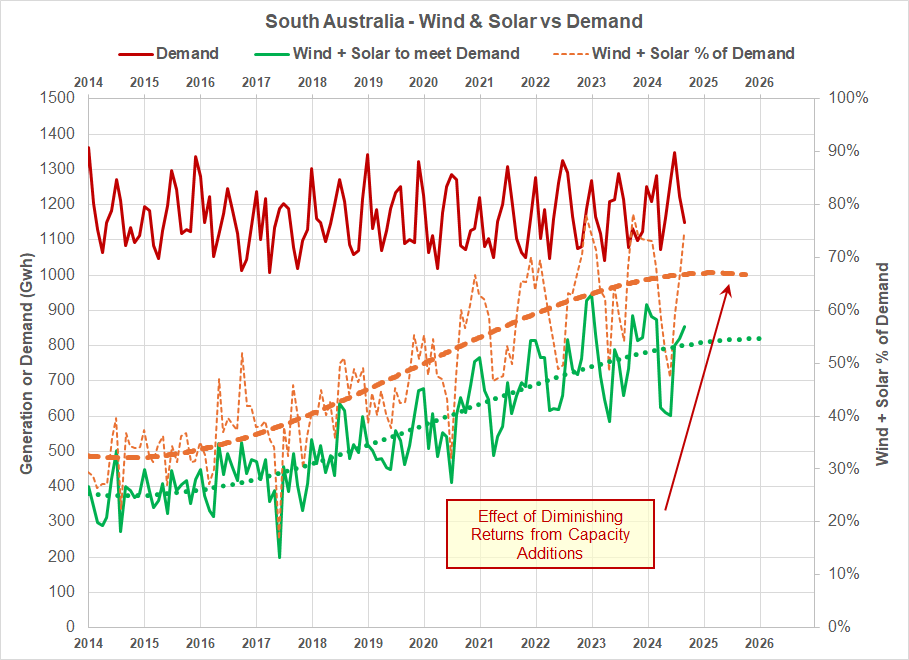
In the final graph depicting South Australia's real-time energy data (Figure 4), a notable trend emerges: as the combined capacity of Wind and Solar increases, the growth in net generation appears to slow and eventually plateau. This observation illustrates that with expansion of renewable energy sources like wind and solar, there's an evident trend where the rate of increase in net generation does not keep pace with capacity additions.
The Potential Role of Energy Storage and Export Capability
Energy Storage: An evident solution to the problem of curtailment is to store the excess energy produced during high generation periods for use when wind and solar output decreases. However, the scale of storage needed to accommodate significant amounts of curtailed energy is enormous, leading to considerable increases in infrastructure costs, which are ultimately passed on to consumers. I will delve deeper into the economic implications of this approach in an upcoming SubStack article.
Exporting Excess Energy:
Another strategy involves exporting the surplus energy to neighboring grids. However, this approach faces several limitations:
Interconnector Capacity: The physical infrastructure that connects different grids has limited capacity, which restricts how much excess can be exported at any given time.
Receptivity of Neighboring Grids: The ability of other grids to absorb this additional electricity depends on their current demand and generation status. They might not always have the capacity or need for this imported power.
Pricing Challenges: To facilitate export, the excess energy often has to be sold at significantly reduced prices. This can lead to a negative impact on the revenue of the exporting grid, indirectly increasing consumer costs as the costs of production are not offset by sales.
Data Sources
UK Elexon BSC
The Balancing and Settlement Code (BSC) managed by Elexon provides comprehensive data on electricity supply and demand in the UK.Gridwatch™
Data courtesy of the Elexon Portal and Sheffield University. Gridwatch offers real-time and historical data on UK electricity generation, particularly useful for understanding grid dynamics.Open Electricity
An open platform dedicated to tracking Australia's electricity transition, offering transparent data on renewable energy integration, grid performance, and policy impacts.GridSim V3.0
A grid model built and maintained by W. R. Johnson. This simulation tool provides insights into various scenarios of grid operation and capacity planning in energy systems.
Informative and easy read, keep up the good work.