How is LOCE Calculated
The Levelized Cost of Electricity (LCOE) represents the average cost per unit of electricity generated over the lifetime of a power plant. It is calculated by dividing the total lifetime costs (fixed and variable) by the total electricity generated, typically expressed in dollars per megawatt-hour ($/MWh). LCOE accounts for multiple components, including capital expenses, operational costs, fuel costs, and the plant’s generation efficiency. Below, these components are broken down into fixed and variable costs, with additional consideration of the Capacity Factor (CF).
Fixed Costs
Fixed costs remain constant regardless of the amount of electricity generated or sold.
Capex, Financing, and Return on Investment: These costs reflect the initial capital expenditure (Capex) to construct the facility, financing expenses, and the expected return on investment. They must be recovered over the plant’s lifetime, independent of actual electricity sales to the grid.
Fixed Operation and Maintenance (O&M) Costs: These include ongoing expenses such as administration, payroll, employee-related costs, and other overhead, which do not vary with power production.
Variable Costs
Variable costs scale directly with the amount of electricity produced (net generation).
Variable Operation and Maintenance (O&M) Costs: These costs are tied to the act of generating power. Examples include routine maintenance, payments to contractors, supplies, and other production-related expenses.
Fuel Costs: Fuel expenses depend on the amount of electricity generated and are a significant variable cost for fuel-based plants like gas turbines.
Net Generation vs. Capacity Factor (CF)
The Capacity Factor (CF) is a critical factor in calculating LCOE. It measures the ratio of actual electricity generated to the maximum possible output if the plant operated at full capacity continuously. A higher CF reduces the LCOE by spreading fixed costs over more units of electricity.
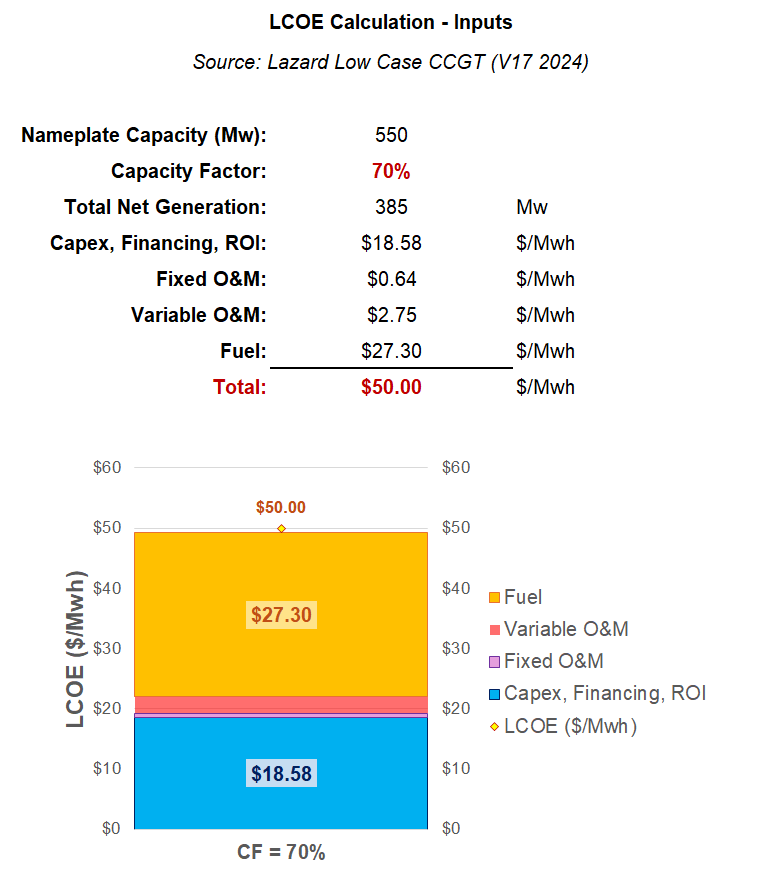
For example, Figure 1 illustrates how these components—fixed costs, variable costs, and CF—contribute to the overall LCOE of a Combined Cycle Gas Turbine (CCGT) operating at a Capacity Factor of 70%.
Impact of Capacity Factor on LCOE for CCGTs
Combined Cycle Gas Turbines (CCGTs) are dispatchable power plants, meaning their output will varied as needed to balance electricity supply and demand. They often serve as backup for variable renewable sources like wind and solar, which depend on weather conditions. As a result, the Capacity Factor (CF)—the ratio of actual electricity generated to the maximum possible output—is not constant for CCGTs and can fluctuate significantly based on grid requirements.
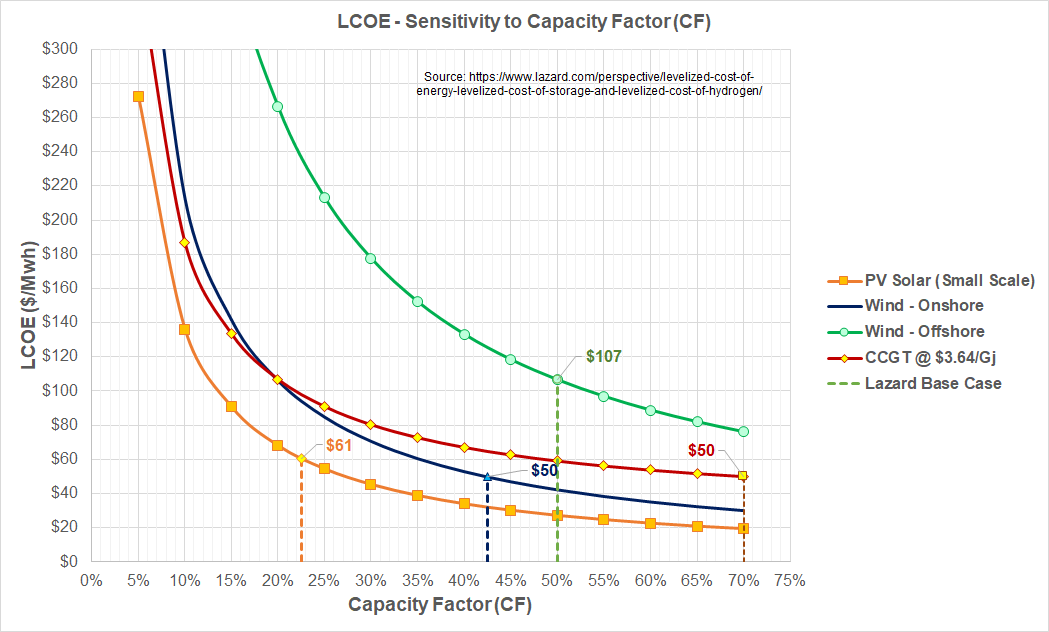
Figure 2 illustrates how LCOE varies with Capacity Factor. As CF decreases, the Levelized Cost of Electricity (LCOE) increases. This inverse relationship occurs because fixed costs (e.g., capital investment and fixed O&M) are spread over fewer units of electricity when generation drops, driving up the cost per unit.
Economies of Scale and LCOE
The nameplate capacity of a facility—its maximum rated output under ideal conditions—can influence the Base LCOE (Levelized Cost of Electricity). Larger facilities often benefit from economies of scale, where higher capacity reduces the per-unit cost of construction, operation, and maintenance due to efficiencies in resource use and infrastructure. However, the relationship between Capacity Factor (CF) and LCOE, as shown in Figure 2, remains unchanged: a lower CF still increases LCOE, regardless of the facility’s size.
How It All Adds Up
Figure 3 compares two scenarios to illustrate how Capacity Factor (CF) affects the Levelized Cost of Electricity (LCOE) for a Combined Cycle Gas Turbine (CCGT):
Base Case: Assumes a Capacity Factor of 70%, consistent with Lazard’s estimates for typical CCGT operation.
Case 1: Reduces the Capacity Factor to 20%, a scenario that becomes more likely as Variable Renewable Energy (VRE), such as wind and solar, increases on the grid, lowering CCGT dispatch.
Cost Breakdown
Fixed Costs: In both cases, the Hourly Expense for fixed costs (e.g., capital repayment, fixed O&M) remains constant, as it is independent of generation. However, the LCOE Component—the contribution of fixed costs to LCOE—increases in Case 1 because these costs are spread over fewer megawatt-hours of electricity.
Variable Costs: Both the Hourly Expense (e.g., fuel, variable O&M) and the LCOE Component of variable costs remain unchanged per unit of generation, as they scale directly with output.
Net Impact on LCOE
The total LCOE, calculated as the sum of all LCOE Components, rises significantly in Case 1. For example:
Base Case (70% CF): Net LCOE is lower (e.g., $50/MWh, as per Lazard).
Case 1 (20% CF): Net LCOE increases to $98/MWh, a $48/MWh rise, driven by the higher fixed-cost burden per unit of electricity.
Key Insights
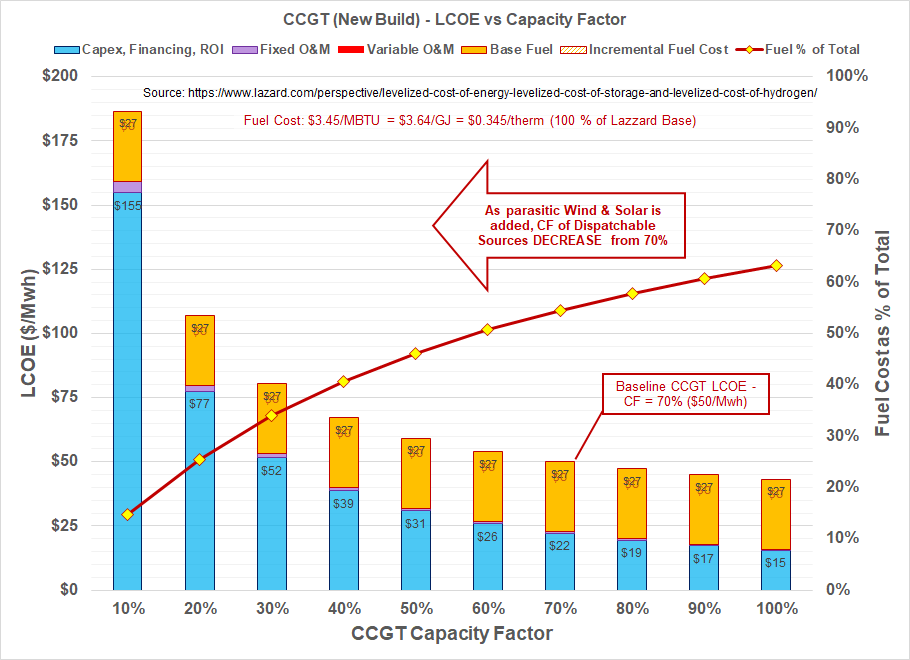
Fuel Costs’ Share: Fuel costs as a percentage of LCOE decrease as Capacity Factor falls, since fixed costs dominate at lower CFs.
CF vs. Fuel Costs: Capacity Factor has a far greater influence on LCOE than fuel costs, minimizing the impact of spikes in fuel prices.
Figure 4 further illustrates the relationships between Capacity Factors, LCOE and Fuel Costs
Key Takeaways
LCOE and Capacity Factor: The Levelized Cost of Electricity (LCOE) is inversely proportional to Capacity Factor (CF). Lower CFs lead to higher LCOE, as fixed costs are spread over less generation.
Impact of Renewables: As wind, solar, and other variable renewable energy (VRE) sources are increasingly integrated into grids, dispatchable generation like natural gas CCGTs, will be displaced, reducing their CFs and driving up electricity costs.
Role of Dispatchables: Despite lower CFs, dispatchable units remain essential for grid stability, as detailed in Wind/Solar - The Effect of Diminishing Returns. Their ability to provide peak generation ensures they won’t be decommissioned, even with reduced overall utilization.
Fuel Costs: Have a declining role as capacity factors decrease.


You are correct that Wind Droughts are a problem for grids. However, I am trying to understand the net effect on the whole system.
On a grid with wind/solar backed up by dispatchables such as coal or gas, wind droughts are nearly invisible to the ordinary consumer. This is because during the drought, gas or coal steps in to maintain grid stability and maintain a reliable energy supply.
In this case, the real concern is the high variability of VRE which includes wind droughts. The issue is that while more wind and solar reduces AVERAGE Net Generation of coal/gas, it still requires a PEAK generation that requires all facilities to remain in service.
To the perspective of dispatchables, it does not matter if wind and solar are low for 1 hour or 10 days.
This is very apparent on grids like the UK, Australia, Texas, Germany, California etc.
As energy storage is built up with the intent of eliminating hydrocarbons, this is where wind (and Solar) droughts really come into play.
The longer the wind droughts exist, the higher the total energy capacity (GWh) of energy storage you need.
To support the additional storage capacity, they must also install significant amounts of wind and solar capacity to charge it.
Contrary to poplar opinion, storage does not sop up 100% of curtailment so needs additional charging capacity.
This becomes very expensive both in Capex and FCOE.
The extreme case of low CF for wind is the wind drought when there is little or no wind and there is a “solar drought” at night when CF in zero. Wind droughts at night are the fatal impediment to the net zero program because the grid has to be fed continually and breaks in continuity should disqualify the intermittent providers from the grid.
Failure to take account of wind droughts has caused the sabotage of the grid although this only became apparent after wind became a significant contributor. Still it needs to be clearly understood and windmills should be taken off the grid at the earliest opportunity. The cost of windpower, however it is calculated, is practically irrelevant because it is not fit for purpose.
Wind droughts are periods with little or no wind across continental or subcontinental areas for periods up to several days in Australia and North America, and weeks for the Dunkelflautes in Europe.
Australian investigators clearly defined wind droughts by 2012 and they could have been the most important discovery in the 20th century if they had been found before the obsession with wind and solar power prompted the expenditure of trillions worldwide to obtain more expensive and less reliable power with massive collateral damage to the environment.
https://rafechampion.substack.com/p/the-late-discovery-of-wind-droughts
https://open.substack.com/pub/rafechampion/p/we-have-to-talk-about-wind-droughts
The silence of the meteorologists calls for investigation especially when we find, thanks to John Maclean, that the first assessment report of the IPCC in 1990 recommended a survey of the wind resources of the world to assess the possibilities for large-scale wind power.
This offers a point of entry to undermine the climate scam and the net zero ponzi by tracing the complicity of the meteorologists in a conspiracy of silence at the heart of the evil empire. Remember that the WMO was a first mover in the climate alarm industry in the United Nations and continues daily to promote that fraud in practically every bulletin that they issue to the public.
https://www.flickerpower.com/index.php/search/categories/general/escaping-the-wind-drought-trap