


NEM Grid Model by David Osmond
A follow up to Chris Bond's June 24, 2025 Article "Another 28 Days Later"

Chris Bond has published an excellent review of David Osmond’s Near 100% grid. You can read it here: (Another 28 Days Later) review
David’s original post can be seen here: LINK where he claimed: “A near 100pct renewable grid for Australia is feasible and affordable, with just a few hours of storage”
At the time, I completed my own review and found David’s grid model lacking in many areas; You can read my critique here: LINK
Based on Chris Bond’s work, I thought it was a great time to go back and do a hindcast to see how David’s model has faired.
David Osmond’s recent post (May 21, 2025 to Jun1 17, 2025)
Published for what he calls week 196 - 199 of his database. This is as per Chris Bond as David Blocked me instead of entering into a professional discussion.
He is currently using the following Multiplication factors to increase generation.
Wind: 4.2
Utility PV: 2.5
Rooftop PV: 1.9
As far as I can deduce, he has not changed his methodology so all my previous comments are still valid.

My Review……
Figure 2 - Net Generation
Higher Resolution Data: My analysis uses 5-minute data, revealing greater variability in generation compared to David’s longer-term averages. This is critical, as the grid operates on a second-to-second basis, and extended averaging can obscure real-time fluctuations.
Real-Time Net Generation: The wind and solar generation values I present reflect what was actually applied to meet real-time demand. Surplus generation, used for charging storage or curtailed, is excluded.
Dispatchable Sources for Stability: Wind and solar are never permitted to supply 100% of demand. To maintain frequency control, dispatchable sources such as storage discharge or other low-carbon fuels always form part of the generation mix.
Actual vs. Potential Generation: Unlike David’s graph, which depicts potential generation for a more striking but less accurate representation, my analysis focuses on actual generation supplied to the grid.
This is opposed to David’s plotting of Potential generation which makes for a more impressive, but much less accurate depiction.
See Figure 2a for a real-time example we see today in South Australia.
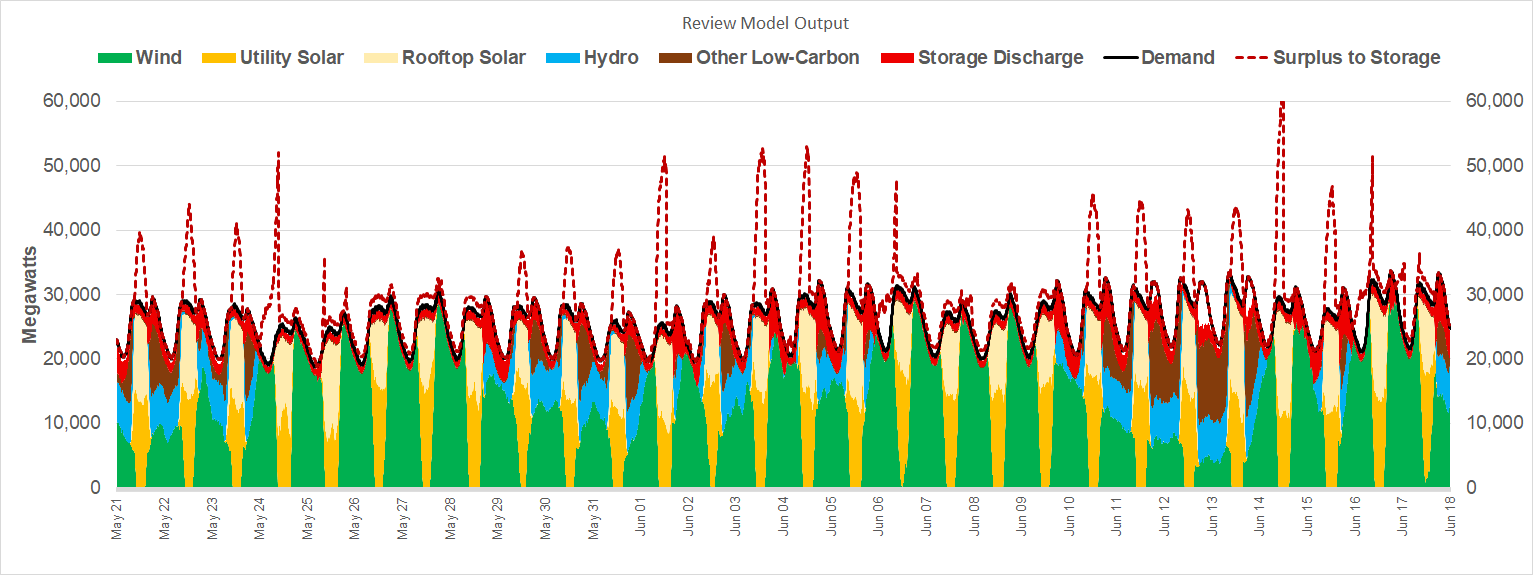
Figure 2a
You can see the effect of rooftop solar forcing curtailment of Utility Solar and Wind in South Australia’s current real-time data.

Figure 3 - Storage Level and Shortfall (Demand Response and Blackouts)
Similar to David’s graph, my analysis displays the total Energy Storage Level. Additionally, I’ve included a trend line for Shortfall, defined as Demand minus Supply.
Key observations:
Minor shortfalls (< 100 MW): might be managed through Demand Response. However, this practice constitutes a form of rationing and should be avoided.
Large Shortfalls: Significant shortfalls, reaching up to 6,350 MW, will directly result in forced blackouts, posing serious risks to grid reliability.
Most shortfalls are far to large to be managed by Demand Response and will result in blackouts. During this period there would be at least 5 blackouts.

Figure 4 - Curtailment & RE % of Demand
Unlike David’s analysis, this graph presents several key indicators related to renewable energy and storage dynamics:
Surplus Utilization: The majority of surplus wind and solar generation is directed toward charging energy storage systems.
Curtailment Trigger: When storage reaches its maximum State of Charge (SOC_max), any additional surplus wind and solar generation is curtailed.
Variability in Renewable Contribution: The percentage of demand met by renewables shows significant variation, as evidenced by the following models:
David’s Model: 95%
Chris Bond: 85.4%
GridSim 4.0: 92.7%
RE % of Demand vs. Shortfall (Supply < Demand)
While the Renewable Energy Percentage of Demand (RE % of Demand) is a valuable metric, it does not ensure the grid’s ability to deliver reliable electricity to consumers. As illustrated in Figure 3, significant shortfalls or reliance on demand response occur during the analyzed period, highlighting challenges in maintaining consistent supply.

Figure 5 - Other Low-Carbon Fuel Backup
In David’s Model he states: “If the wind, solar, storage and hydro was unable to meet demand, then the model supplements generation with ‘Other’. ‘Other’ was deliberately left undefined. It could be gas generation. Indeed, in the short to medium term it is likely to be existing gas peakers that will help firm renewables along with storage and hydro.”
GridSim shows that significant amounts of “Other” fuels would be required. I have set the “Other” fuel capacity equivalent to current Nat Gas Capacity.
This would require massive Capex to build synthetic fuel production facilities and tying into the existing supply infrastructure to feed Nat Gas plants.
Synthetic Fuels will also be significantly more expensive than Nat Gas, increasing consumer costs even further.

Economics
David Osmond claims his model delivers power at a wholesale price of $95/MWh. However, this estimate is flawed. GridSim V4.0 calculates a significantly higher wholesale price of $283/MWh.
The discrepancy stems from differences in calculating the Levelized Cost of Energy (LCOE):
David’s Methodology: His approach underestimates costs, particularly as wind, solar, and storage displace natural gas or other low-carbon fuels. At low capacity factors, his LCOE estimates become highly erratic and significantly understate true costs.
GridSim V4.0 Methodology: Calculates LCOE for each generation type (e.g., wind, solar, storage) separately, providing a more accurate and granular cost assessment.
As shown in Figure 6, both methods yield similar results when using Lazard’s average values. However, David’s method fails to account for the impact of low capacity factors, leading to substantial cost underestimation. In contrast, GridSim V4.0’s approach, by evaluating each generation source independently, ensures a more reliable Full Cost of Energy (FCOE, or Grid LCOE) calculation based on total generation.

Methodology
This review utilizes a highly detailed Grid Model (GridSim V4.0).
The following operating data inputs are downloaded from: https://explore.openelectricity.org.au/
All data is recorded in 5-minute intervals.
Net Grid Demand
Onshore Wind Nameplate Capacity
Onshore Wind Net Generation
Utility Solar Nameplate Capacity
Utility Solar Net Generation
Rooftop Solar Nameplate Capacity
Rooftop Solar Net Generation
The model incorporates numerous settings to ensure accurate simulations. Below are key parameters and their roles:
SF/Utilization Ratios: These account for scheduled maintenance and downtime, recognizing that Wind Turbines, Solar Panels, and Battery Energy Storage Systems (BESS) cannot operate at 100% availability.
Curtailment Adjustment Factors: These align the Grid Model Output with real-time grid performance for the current year, minimizing the impact of real-time curtailment on data inputs.
Base Loading: Renewable Energy (RE) sources such as Hydro, Biomass, and Other RE can be prioritized to generate a portion of available capacity before Wind, Solar, or Storage are utilized. This approach reduces the required capacity for Wind, Solar, and Storage systems.
Energy Storage Constraints: Storage systems face limitations to ensure operational efficiency and longevity:
Current Storage Capacity: Defines the available capacity for charging and discharging.
State of Charge (SOC) Limits: Typically set at 10% (Low) and 90% (High) to extend service life. These limits may be briefly exceeded to offset Demand Response, on an exception basis.
Charge/Discharge Rate: Determined by the technical design, particularly inverter sizing. For example, a 400 MWh facility with a 4-hour duration has a maximum charge/discharge rate of 100 MW.
Calculation Sequence and Logic
Total Demand: Calculated first to establish the baseline energy requirement.
Generation Dispatch: Applied in a sequence mirroring the NEM Merit Order:
Base Load: Prioritized to meet initial demand.
Renewable Energy (RE): Applied in the following order:
Rooftop Solar
Utility Solar
Wind
Surplus RE: Directed to charge Battery Energy Storage Systems (BESS), subject to constraints (e.g., storage capacity, charge/discharge rates, and State of Charge limits). Storage losses are calculated and deducted from available discharge capacity.
Other Renewables: Hydro, Biomass, and Biogas are applied to meet remaining demand.
Hydrocarbons/“Other”: Used to address any shortfall. “Other” refers to low-carbon fuels (e.g., synthetic fuels or hydrogen), as defined by David. For this scenario, capacity is optimistically set equal to existing natural gas generators, though the feasibility of building this capacity and its energy source remains uncertain.
Shortfall Calculation: Any unmet demand is quantified.
This methodology aligns closely with Chris Bond’s calculations, though GridSim may incorporate slightly more rigorous modeling.

Assessment of David Osmond’s Model
David Osmond’s model appears to be unchanged from its initial publication, ignoring several critical errors and omissions:
Unrealistic Demand Data: The model uses current demand data, ignoring the multi-year timeline required to install the proposed additional capacity, rendering projections impractical.
Linear Capacity Scaling: It assumes that increasing capacity proportionally increases net generation, disregarding the Law of Diminishing Returns, which limits output as capacity scales.
Unrealistic Service Factors: The model assumes 100% Service/Availability Factors, neglecting redundancy for equipment failures, planned or unplanned maintenance, and anomalies in wind or solar generation.
Overestimated Storage Availability: It assumes 100% of storage capacity is usable, whereas real-world constraints typically limit usable storage to 80–90% due to State of Charge (SOC) restrictions for longevity.
Lack of Dispatchable Power: The model fails to ensure a minimum level of fully dispatchable power at all times, risking grid failure within minutes due to insufficient reserve capacity. David’s model has frequent periods when wind and solar at the sole source of power for the grid.
Neglect of Grid Stability Factors: No provisions are made for inertia, reactive/apparent power management, or load following. Hydro, when transmitted over long distances, cannot meet these needs. While energy storage may provide synthetic inertia, this further constrains usable capacity to maintain room for absorbing excess generation or covering shortfalls, reducing available storage for wind or solar backup.
Understated Wholesale Costs: The model’s cost calculations are flawed due to:
Inaccurate accounting for low capacity factors, which inflate costs.
Significant underestimation of energy storage costs, ignoring arbitrage.
Yes, Grid Sim is my model. I have been developing & refining it for > 5 years.
I use real-time data to reconcile it against reality and the results are always good. Some differences of course, but they are minor and have mostly to do with operators decisions. (i.e. individual generators like coal, gas, etc might vary a little, but total Hydrocarbons are always close. Hydro is challenging since it is seasonal, but I have past real-time data to adjust inputs.
To give you some idea of the scope, each time-segment has 216 individual calculation steps many of which include logic tests.
I use 5-minute data so there are 105408 time segments in a year
Total calculations per run are 22.8 Million. Needless to say, changes aren't quick!
I have worked with David's "foresight" concept, but it is meaningless and I do not include it. Due to how my model functions by looking at discrete time-segments the concept is meaningless. I use a full year of real-time data so there is no need for foresight.
I did experiment with David's idea of using nat gas to top up storage. However, after many runs and tests, I found it did not make any difference. I have also studied the concept on the ERCOT (Texas) grid and found the same thing. It just adds costs.
I am currently working on a Substack article providing details of how GridSim works. It be a while before I can publish it, but I will make sure you see it.
Hi Bill, thank you, lots for me to chew on there.
Question: is "GridSim" your model?
Further comments on DO's "simulation" methodology which I've only hammered out via LinkedIn the last couple of days:
Per FAQ 3 way down at the bottom of his Renew Economy article:
"3. Does your model assume perfect foresight? For the first 6 days of each 7-day simulation, my model assumes 24 hours perfect foresight. That is, it knows exactly what the wind, solar and demand will be 24 hours in advance. AEMO can reasonably accurately predict these quantities 24 hours in advance (and beyond), though not perfectly. For the last day of my 7-day simulation, the length of the perfect foresight linearly reduces to zero hours."
On LI he stated he has recently reduced this to 16 hours of perfect foresight i.e. forecasting.
And when his "simulation" sees tricky conditions ahead in the 16 hours, it optimises / completely changes dispatch of Hydro, adds 'other' if necessary to charge storage, all to achieve lower Curtailment overall.
[link to some of it]
https://www.linkedin.com/feed/update/urn:li:ugcPost:7343174619756986368?commentUrn=urn%3Ali%3Acomment%3A%28ugcPost%3A7343174619756986368%2C7343629772662472704%29&replyUrn=urn%3Ali%3Acomment%3A%28ugcPost%3A7343174619756986368%2C7345042875933491201%29&dashCommentUrn=urn%3Ali%3Afsd_comment%3A%287343629772662472704%2Curn%3Ali%3AugcPost%3A7343174619756986368%29&dashReplyUrn=urn%3Ali%3Afsd_comment%3A%287345042875933491201%2Curn%3Ali%3AugcPost%3A7343174619756986368%29